
July 5, 2015
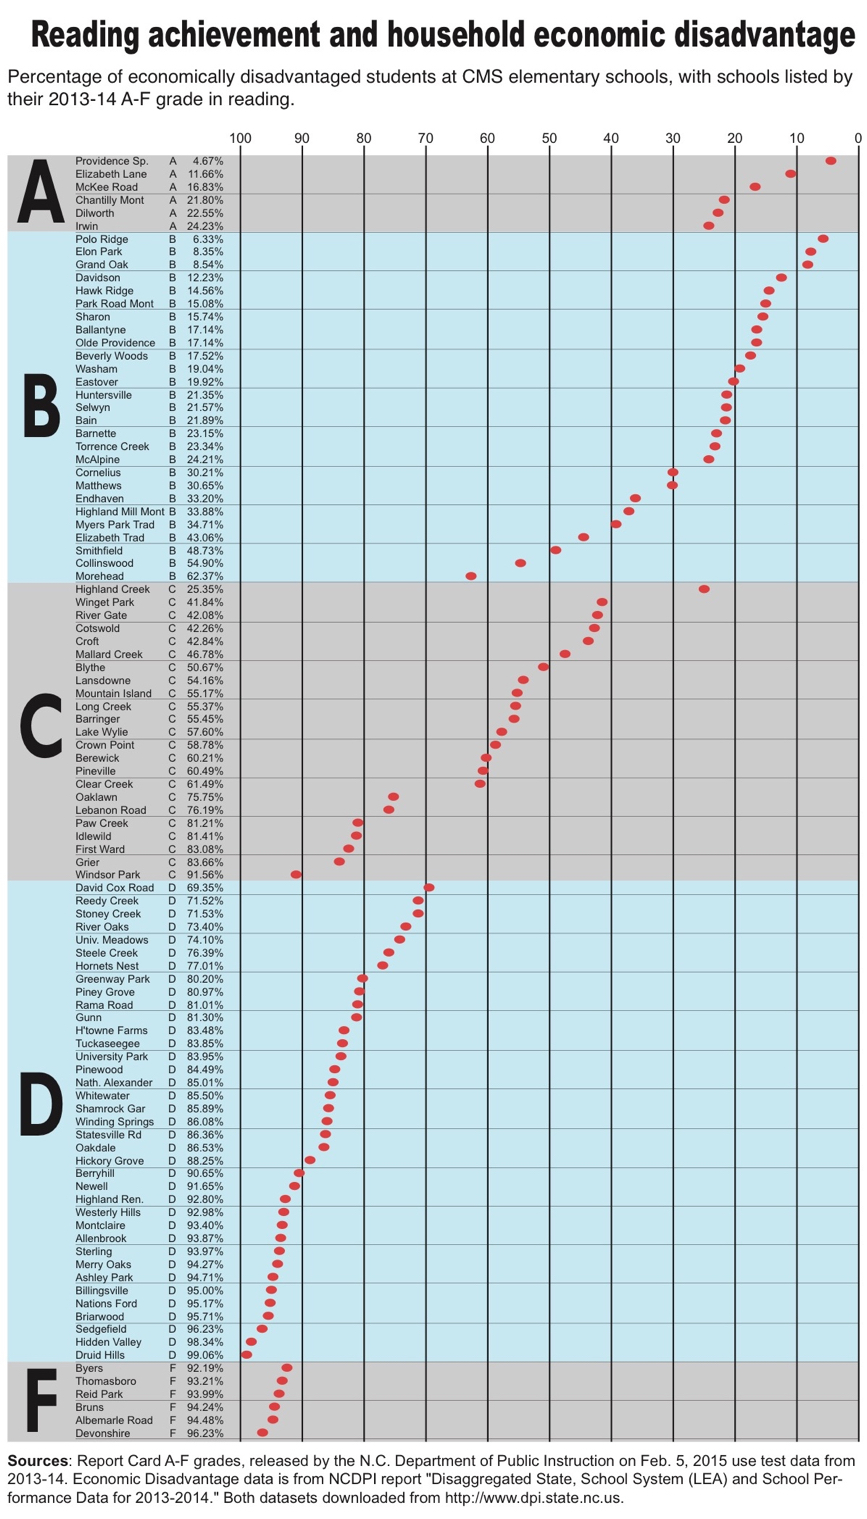
Above is the latest revision of an old chart. The message is always the same: Schools full of economically disadvantaged children record unacceptable levels of academic achievement. The reasons keep being debated. But the reality stays the same.
Two similar charts using earlier datasets are here. They date from 2004 and 2008. The chart above can be downloaded as a PDF here.
But this February the state stamped an A-to-F grade on every schoolhouse. Above is the list of CMS elementaries, first ordered by their reading scores, A through F; then within each grade ordered by the percentage of economically disadvantaged children in the schoolhouse in the same year. The data is for 2013-14.
Let’s just say there are no F schools where the children come from wealthy homes.
The current CMS assignment plan builds schools around neighborhoods. In its implementation of the board’s directive, staff was in general scrupulous to separate wealthy areas of the county from poor ones. The result was dozens of schools where nearly all the children are poor. As a general rule, teachers at such schools have the least experience, and don’t stay long. The principal’s office is often a revolving door.
In the current assignment review, it has not been lost on school board members that their predecessors’ decisions in 2001 to adopt a neighborhood-based assignment plan has left them with schools that don’t work.
The question is what to do instead, and whether board members will agree to it.
– Steve Johnston