
Aug. 8, 2015
Back in April, the members of the CMS Policy Committee began looking at student assignment. And one of their first questions was: Help us understand the differences between Wake and Mecklenburg Counties.
That’s a tall order, and a broad one too. It involves differences in local histories, industries, average income, demographic differences, size in square miles, history, etc.
I was directed recently to a Brookings Institution mapping program that offers county-by-county data across the nation based on 2013 population estimates.
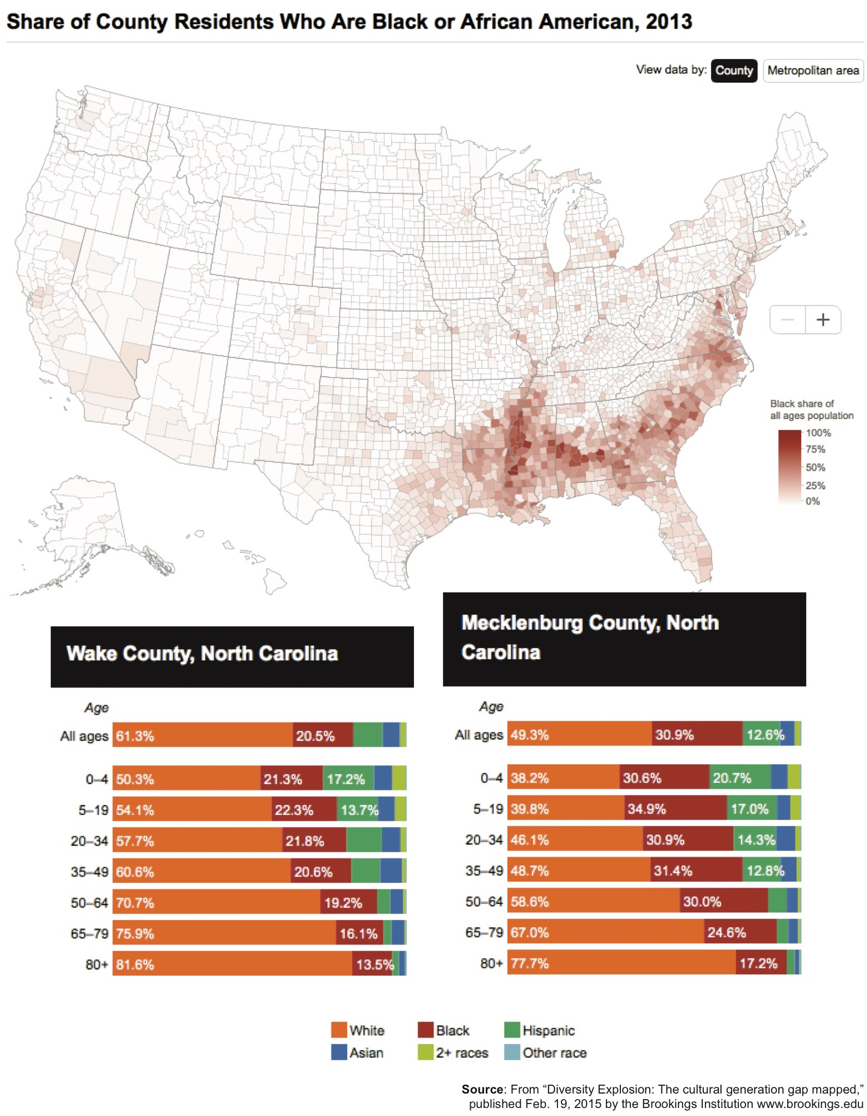
The national map is above, set to show the percentage of African Americans of all ages in all counties. The map reflects what we know: African-Americans are most heavily concentrated in the Mississippi Delta and in coastal and Piedmont counties in the Carolinas.
The two datasets for Wake and Mecklenburg get at some of the contrasting demographics of the two N.C. counties. Points to consider:
– Wake is whiter than Mecklenburg. Mecklenburg’s black population is, by percentage, 50% larger than Wake’s.
– In both counties, more and more Hispanic youngsters are about to enter the school-age population They’re already here.
– In both counties, African-Americans die young or leave. The result is that the older age groups are considerably whiter than the overall population.
– And consider this: The kids are in schools run by an older generation that doesn’t look them, and probably doesn’t think like them, either. The colonists complained to George III about taxation without representation. Are there echoes of a new American revolution here?
– Steve Johnston