March 21, 2008
Academic performance and poverty
As schoolhouse poverty rates fall, scores rise – and this is neither new, nor news
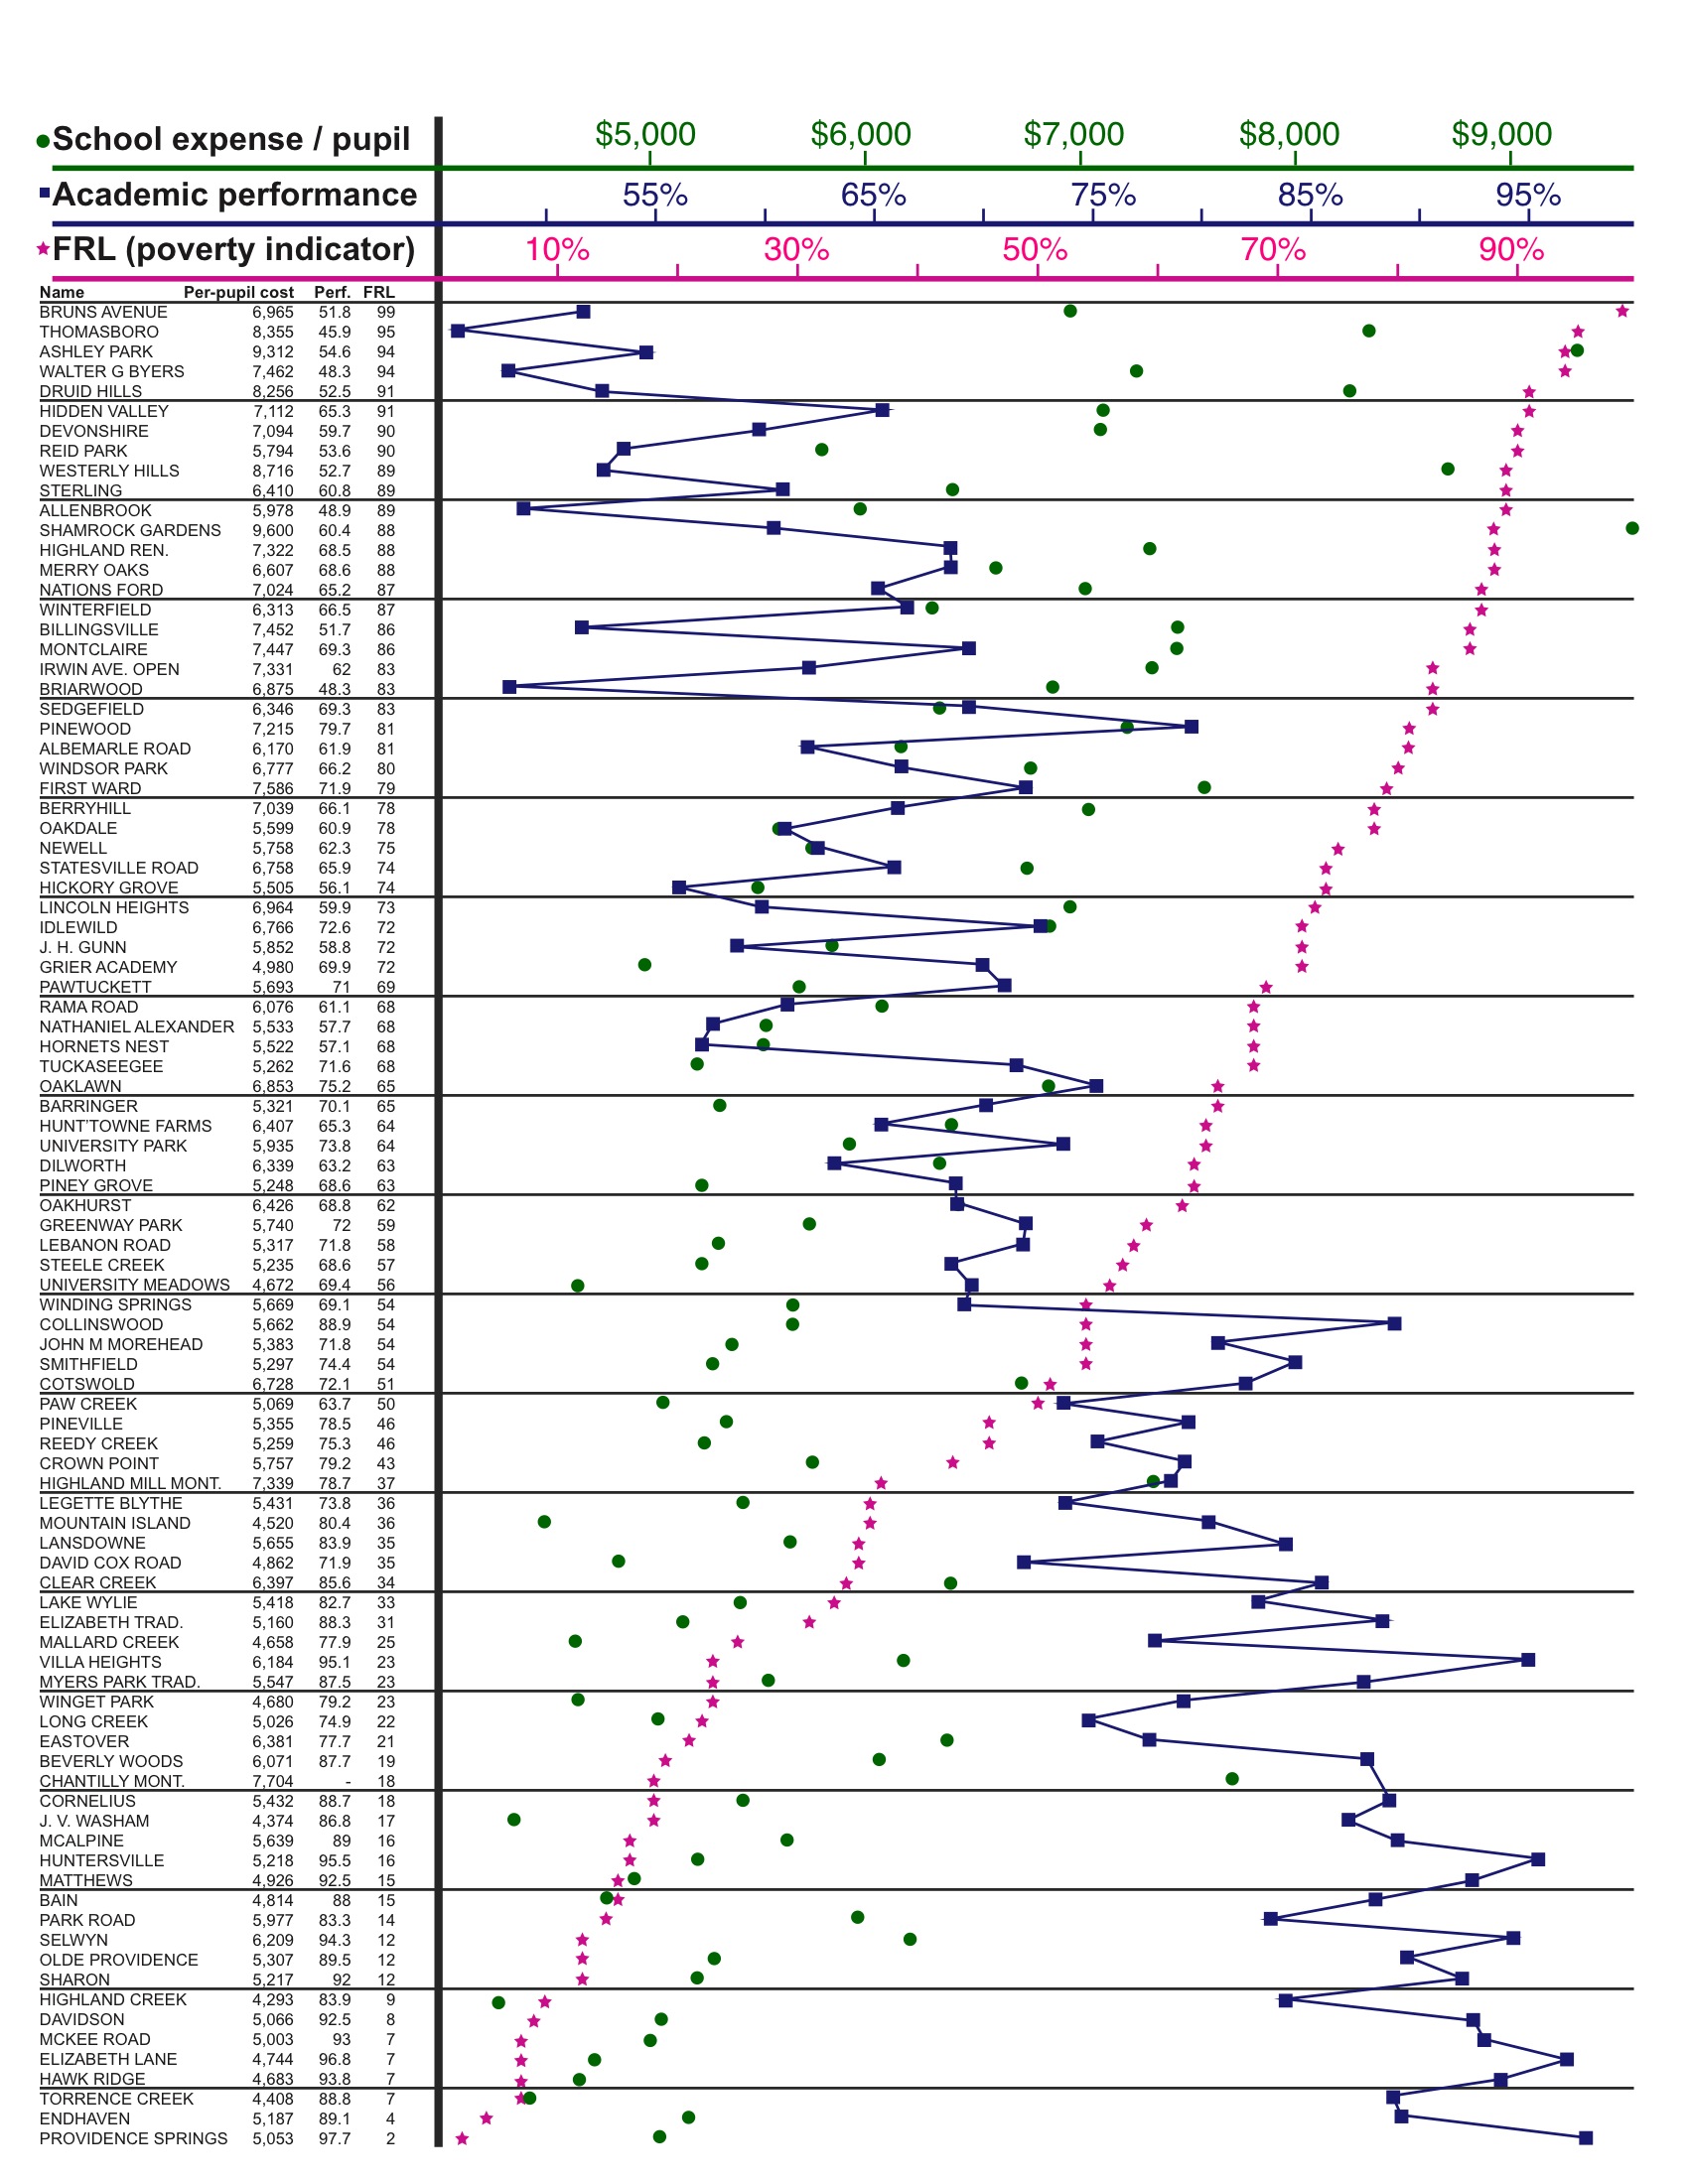
At a meeting with the Fellowship in February, CMS Supt. Peter Gorman said he knew of no data that correlate to academic performance better than poverty statistics. The chart below, based on CMS data for all its elementary schools, proves the point: Across the system, as children’s poverty rates fall – the red stars below – a school’s academic performance generally rises. The trend is undeniable.
The green dots mark one CMS effort to counteract the effects of poverty: When it resegregated schoolhouses in 2002 by economics, assigning most poor students to a few dozen majority-poor schools, CMS vowed to keep class sizes low and supply closets full at those schools. Evidence from staff reports provided to the CMS Equity Committee suggest that CMS has been relatively successful with the supply closet. But enrollment growth has left lots of classrooms in high-poverty schools with 25 or more students, not the mandated 16.
The result, among other things, is that CMS has been unable to break the correlation Gorman cites between poverty and poor academic performance. The higher expenses per student at high-poverty schools may be the cause for academic performance at those schools being as good as it is. But they have not boosted low-income children to parity, or even to “passing.”
Charlotte-Mecklenburg is ignoring the problem. It has set up thousands of its children to fail in school – and probably in life.
While the trends are undeniable, the patterns are not new.
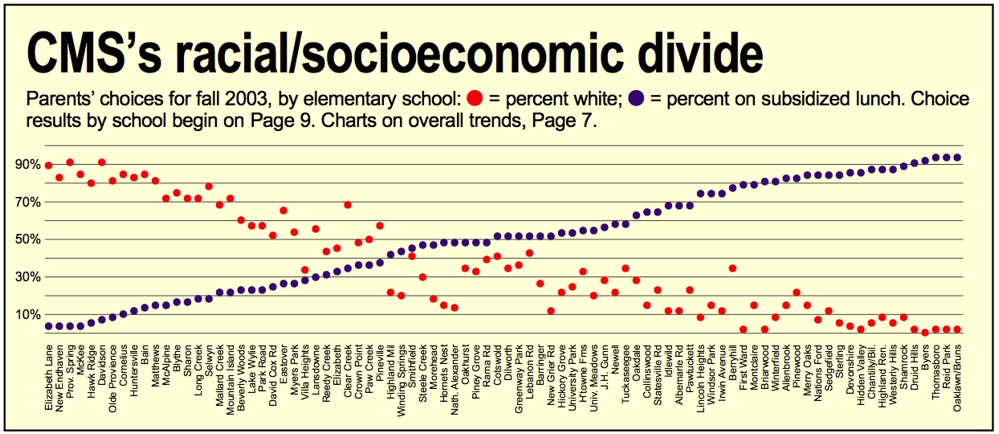
Consider the yellow chart at the bottom of this page. It was first published four years ago. Using data available at the time, the yellow chart tracks percentage white and percentage poor by schoolhouse. In this community, where poverty and race remain linked, the visual result is the same in 2004 and 2008: Struggling students remain struggling students.
CMS educators have long promised to break the correlation between poverty and poor performance. They have not – and many experts would argue that they cannot if poor children remain isolated. It will take community action or outside intervention to create the sacrifice required to educate all children for a successful life.
The first step is awareness of the problem. The second step is owning the problem.

A larger version of the chart above can be downloaded here.